Medical Billing and Coding Specialist Salary in Virginia: $29,997 (2026)
Quick Answer:Across Virginia's 42 metropolitan areas, the average median medical billing and coding specialist pay sits at $29,997/year heading into 2026 — a figure projected from 2025 BLS OEWS wage data for SOC 29-2072. Because Virginia sits at BEA RPP 103.2 (3% above the U.S. baseline), that statewide median translates to roughly $29,067 in nationally-comparable purchasing power. Highest-paying metros: Charlottesville ($36,308), Alexandria ($33,822), Richmond ($29,795).
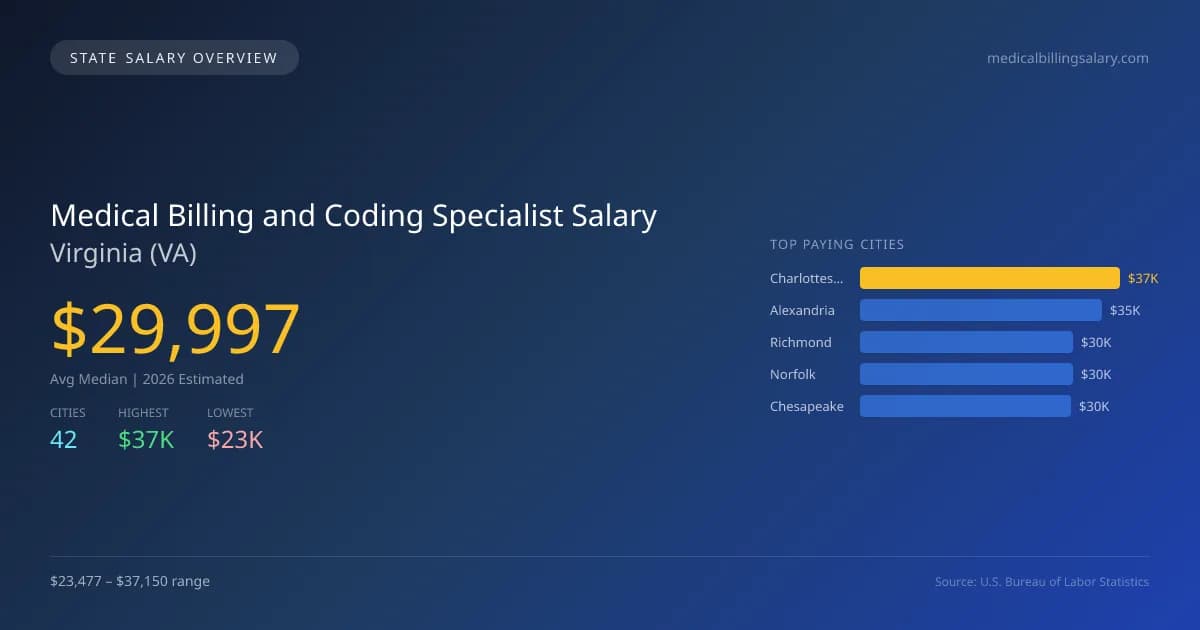
The landscape for medical billing and coding salaries in Virginia shows an average median salary of $29,997 in 2026, which is slightly below the national median of $30,349, resulting in a difference of 1.2%. The salary range across the state's cities varies significantly; Charlottesville leads with $37,150, while Winchester falls to $23,477, marking a substantial gap of $13,673. This disparity can be attributed to factors like local cost of living, demand for services, and the concentration of healthcare facilities. Virginia has specific licensing requirements and scope of practice laws that affect the profession, but demand remains steady, driven by the state's growing healthcare sector and the ongoing need for accurate patient data management. As of 2026, the job market for medical billing and coding specialists shows a projected annual growth rate of 2.32%, reflecting robust employment opportunities within the state. In terms of other key cities, Alexandria offers a salary of $34,607, Richmond provides $30,486, Norfolk at $30,471, and Chesapeake with $30,139. These figures underline the relatively stable earnings in urban centers, while rural areas may lag behind. Overall, Virginia presents solid prospects for those entering the medical billing and coding field, particularly in cities with concentrated healthcare services.
Virginia Medical Billing and Coding Specialist Salary Range
Overall salary range in Virginia: $18,783 (lowest entry-level) to $53,640 (highest top earner)
Virginia vs National Average
Virginia medical billing and coding specialists earn 1.16% less than the national median ($-352/year difference).
Virginia Medical Billing and Coding Specialist Salary Distribution (2026)
Medical Billing and Coding Specialist salaries in Virginia range from $21,864 (entry-level, 10th percentile) to $44,227 (top earners, 90th percentile), with a median of $29,997. The Virginia median is $352 below the US national median of $30,349. The average hourly rate is $14.42/hr. Approximately 2,891 medical billing and coding specialists are employed across 42 cities.
2021 BLS Actual
$46,583
2025 BLS Actual
$29,317
2026 Current Est.
$29,997
2021–2027 Growth
+-34.1%
Salary Trajectory for Medical Billing and Coding Specialists in Virginia (2021–2027)
2021–2025: actual BLS OEWS data for this metro area. 2026+: CAGR 2.32% projection.
| Year | Annual Salary | Status |
|---|---|---|
| 2021 | $46,583 | Actual |
| 2022 | $46,835 | Actual |
| 2023 | $48,982 | Actual |
| 2024 | $50,858 | Actual |
| 2025 | $29,317 | Actual |
| 2026(current) | $29,997 | Estimated |
| 2027 | $30,693 | Projected |
Based on 5 years of BLS OEWS data for the Virginia metropolitan area, the median medical billing and coding specialist salary grew -37.1% from $46,583 (2021) to $29,317 (2025). At a 2.32% compound annual growth rate, salaries are projected to reach $30,693 by 2027 — a total increase of $-15,890 (-34.11%) from 2021.
Note: Historical values (2021–2025) are actual BLS OEWS figures for the Virginia metropolitan area, sourced from annual Occupational Employment and Wage Statistics surveys. 2026–2026 figures are current estimates, and 2027 values are projections, calculated using a 2.32% CAGR derived from 5-year BLS historical data. Actual salaries may vary based on employer, experience, certifications, and local market conditions.
Top 5 Highest Paying Cities in Virginia
Lowest Paying Cities in Virginia
| City | Median Salary |
|---|---|
| Winchester | $23,477 |
| Falls Church | $26,116 |
| Herndon | $26,532 |
| Williamsburg | $26,821 |
| Annandale | $26,872 |
Best Value Cities for Medical Billing and Coding Specialists in Virginia
When adjusted for local cost of living, these Virginia cities offer the most purchasing power for medical billing and coding specialists.
| City | Nominal Salary | CoL Index | Adjusted Salary |
|---|---|---|---|
| Charlottesville | $37,150 | 99.146 | $37,470 |
| Alexandria | $34,607 | 103.2 | $33,534 |
| Staunton | $28,647 | 91.128 | $31,436 |
| Lynchburg | $27,999 | 89.363 | $31,332 |
| Richmond | $30,486 | 97.858 | $31,153 |
Adjusted salary = nominal salary × (100 / CoL index). CoL index: 100 = national average. Lower index = lower cost of living.
Salary by Experience Level in Virginia
| Experience Level | Estimated Annual |
|---|---|
| Entry Level (0-2 years) | $21,864 |
| Mid Career (3-7 years) | $29,997 |
| Experienced (7+ years) | $44,227 |
Estimates based on BLS percentile data averaged across Virginia metro areas. Individual pay varies by employer, certifications, and specialization.
All 42 Cities in Virginia
| # | City | Median Salary |
|---|---|---|
| 1 | Charlottesville | $37,150 |
| 2 | Alexandria | $34,607 |
| 3 | Richmond | $30,486 |
| 4 | Norfolk | $30,471 |
| 5 | Chesapeake | $30,139 |
| 6 | Virginia Beach | $30,023 |
| 7 | Staunton | $28,647 |
| 8 | Newport News | $28,543 |
| 9 | Hampton | $28,291 |
| 10 | Centreville | $28,159 |
| 11 | Lynchburg | $27,999 |
| 12 | Radford | $27,988 |
| 13 | Burke | $27,969 |
| 14 | Harrisonburg | $27,911 |
| 15 | Roanoke | $27,875 |
| 16 | Suffolk | $27,848 |
| 17 | Bristol | $27,823 |
| 18 | Tuckahoe | $27,769 |
| 19 | Ashburn | $27,730 |
| 20 | McLean | $27,728 |
| 21 | Reston | $27,698 |
| 22 | Danville | $27,692 |
| 23 | Fredericksburg | $27,573 |
| 24 | Dale City | $27,568 |
| 25 | Manassas | $27,538 |
| 26 | Blacksburg | $27,507 |
| 27 | Salem | $27,462 |
| 28 | Leesburg | $27,422 |
| 29 | Portsmouth | $27,406 |
| 30 | Mechanicsville | $27,362 |
| 31 | Springfield | $27,266 |
| 32 | Woodbridge | $27,228 |
| 33 | Sterling | $27,176 |
| 34 | Lake Ridge | $27,140 |
| 35 | Linton Hall | $27,110 |
| 36 | Fairfax | $27,040 |
| 37 | Waynesboro | $26,908 |
| 38 | Annandale | $26,872 |
| 39 | Williamsburg | $26,821 |
| 40 | Herndon | $26,532 |
| 41 | Falls Church | $26,116 |
| 42 | Winchester | $23,477 |
More Virginia Salary Data
Hourly Rates
Explore medical billing and coding specialist hourly pay in Virginia cities.
Entry Level
Starting salaries for new medical billing and coding specialists.
Senior / Experienced
Top earner salaries for experienced medical billing and coding specialists.
Explore More Medical Billing and Coding Specialist Salary Data
Frequently Asked Questions
How much do medical billing and coding specialists make in Virginia in 2026?
What is the highest paying city for medical billing and coding specialists in Virginia?
How does Virginia medical billing and coding specialist pay compare to the national average?
What is the entry-level medical billing and coding specialist salary in Virginia?
How many medical billing and coding specialists are employed in Virginia?
Which Virginia city offers the best value for medical billing and coding specialists?
Written by Amina Patel, CPC
Career Analyst
Amina has 10 years of experience in medical billing. She specializes in outpatient coding for multi-specialty practices.
Methodology & Data Source
Statewide salary figures on this page are 2026 projections based on the Bureau of Labor Statistics Occupational Employment and Wage Statistics (OEWS) survey, May 2026 release. A 2.32% compound annual growth rate (CAGR), derived from 6-year national BLS wage trends, was applied to each metro area's reported salary to estimate current 2026 medical billing and coding specialist compensation across Virginia. State averages are employment-weighted across 42 metro areas — larger metro areas with more medical billing and coding specialistscontribute proportionally more to the average, producing figures that better reflect typical compensation. Individual pay varies by city, employer, certifications, and experience.
Data Sources & Methodology
Source: BLS, OEWS, 5-year dataset (–). Per-city data from annual BLS metropolitan area surveys.
2026 figures are projected from 2025 BLS data using a compound annual growth rate (CAGR) of 2.32%, derived from historical BLS wage trends for medical billing and coding specialists (SOC 29-2072).
Compiled and verified by Amina Patel, CPC, a licensed medical billing and coding specialist with 10+ years of clinical experience. · View source data at BLS.gov